
School districts across the country are managing thousands of devices assigned to students and staff. With device loss and misallocation becoming a growing financial burden, more districts are implementing mid-year audits to ensure every device is accounted for. These audits not only protect budgets but also strengthen accountability, streamline reporting, and improve asset management practices
7 Device Breakage Patterns to Review Before You Act

The rate is the beginning of the review.
By November, most technology teams have enough current-year repair activity to see the workload clearly. The overall breakage rate is usually the first number on the page. It is useful, but it cannot tell the team what should change.
That distinction matters in a device environment that is now nearly universal. The National Center for Education Statistics reported that 88 percent of public schools had a 1-to-1 computing program in 2024-25. Among those schools, 46 percent allowed devices to go home on school days and weekends, while 37 percent did not. A districtwide rate can therefore combine very different levels of movement, handling, storage, and instructional use.
The pressure itself is well established. A 2022 EdWeek Research Center survey cited by CoSN found that 43 percent of district administrators considered student-caused device damage a significant issue. CoSN’s guidance goes one step further: districts should collect the kinds of repairs being made and look for trends before deciding how to respond.
The total tells you how much work arrived. The pattern tells you where to look next.
ancing the Learning Experience with Chromebook Accessories Enhancing the Learning Experience with Chromebook Accessories
Use the comparison that fits the question.
Raw counts are easy to misread. Thirty incidents at a 1,500-device high school do not mean the same thing as 20 incidents at a 300-device elementary school. The denominator changes with the question.
| Question type | Use this comparison |
| School, grade, or model | Damage incidents divided by active devices in that segment, compared with the district rate. |
| Damage type or time period | The segment’s share of all incidents, then a second cut by school, grade, or model. |
| Repair experience | Median report-to-ready time, paired with the outcome and the age of still-open work. |
Use one reporting window and the same definitions for every comparison.
- Damage category
Start by separating what happened. A cracked screen, liquid exposure, a damaged hinge, a failed battery, a missing charger, and a manufacturer defect should not enter the same bucket. If everything is coded as ‘broken,’ the report can show volume but cannot point to a response.
District practice already reflects this level of detail. Franklin County Community School Corporation publishes separate repair categories for screens, chargers, keyboards, hinge components, bezels, LCDs, and ports. Your internal list does not need to match theirs, but it should be specific enough that two technicians would classify the same incident the same way.
Review question: Which category accounts for the largest share of incidents, and does that answer stay the same when you compare schools, grades, or models?
- School or physical location
Compare locations using active devices at each site as the denominator. A large school’s raw count may be proportional; a smaller building can be the hotspot even when its total looks ordinary.
Location analysis only works when the record follows the device. A New York State Comptroller review of 20 districts found thousands of entries missing location or assignee data. Its recommended fields include make, model, serial number, assignee, and physical location. Without them, ‘where’ remains an anecdote.
Review question: Which location has the highest rate after fleet size is considered, and what differs there in transport, storage, check-in, or reporting?
- Grade band and usage model
Grade level is useful, but grade level by itself can be misleading. Pair it with the way devices are used: take-home, classroom-assigned, cart-based, lab-based, or shared. Movement changes exposure, and the NCES take-home findings show that schools do not operate under one common model.
CoSN’s sustainability report gives practical district examples. Desert Sands Unified School District noticed increased breakage beginning in seventh grade and changed its case approach. Wichita Falls used thicker cases for middle school students. The lesson is not that every middle school has the same problem. It is that grade-level repair data helped those districts make a targeted decision.
Review question: Which grade-and-use combination is overrepresented, and is the pattern tied to movement, storage, charging, or a specific damage category?
- Device model, age, and warranty status
A model with the most repairs may simply be the model with the most active units. Compare incidents per 100 active devices for each model or purchase cohort, then separate accidental damage from hardware failure and warranty-eligible work.
Google’s school repair guidance points districts to model-specific repair manuals and tells repair teams to check warranty terms before performing work. CoSN similarly recommends considering device end-of-life dates and repairability. Those details matter when one model repeatedly presents the same hinge, keyboard, screen, port, or battery issue.
Review question: Is a model or age cohort producing a higher incident rate, or is it simply the largest group in the fleet?
- Timing and recurring events
Plot incidents by week and place the district calendar beside them. Look around deployment, long breaks, testing windows, field trips, athletics, weather events, and collection. The goal is not to force every spike into a story. It is to see whether the same type of incident returns around the same event.
Google’s Chromebook repair guide notes that constant use and transportation between home and school take a toll on devices. If transport-related screen or hinge damage clusters after a recurring event, the useful response may be a timely reminder, a storage check, or a change in the handoff – not a districtwide policy rewrite.
Review question: Did a spike repeat, and does it remain visible after you separate damage type, location, grade, and usage model?
- Repeat devices or repeat incidents
Separate unique damaged devices from total damage incidents. Eighty incidents affecting 80 devices is a broad fleet pattern. Eighty incidents affecting 55 devices is a different problem. The second group contains repeat history that the overall rate cannot show.
A repeat device is not automatically a repeat-student issue. The device may have been swapped, reassigned, repaired incompletely, or returned to service with the same vulnerable component or case. Review the device history, prior repair type, assignee history, model, and outcome before deciding what the repetition means.
Review question: Are repeat incidents tied to the same user, the same device, the same component, or the same repair outcome?
- Repair outcome and instructional downtime
The final view asks what happened after the report. Keep outcomes distinct: repaired in-house, sent to a vendor, handled under warranty, swapped, waiting for a part, retired, returned with no fault found, or still open. Then measure the time from report to a usable device – not simply the time until a ticket was touched.
Use the median to describe the typical experience and review the oldest open work separately. Google’s school repair guidance frames turnaround as a learning-continuity issue: the point is to get working devices back to teaching and learning. A long turnaround concentrated in one outcome can reveal an intake, parts, approval, vendor, or ownership bottleneck even when the breakage rate is stable.
Review question: Which repair outcome keeps devices out of instruction the longest, and where does the waiting time actually occur?
Write the pattern before you choose the action
A useful review should end with one sentence that can be tested. It should name the period, the segment, the comparison, the leading damage type, and the repair experience.
ILLUSTRATIVE PATTERN STATEMENT
From September 1 through October 31, Grade 7 take-home devices represented 22 percent of active student devices but 38 percent of physical-damage incidents. Screen damage created most of the difference, while median repair turnaround was consistent with the district. Next, compare case use and transport or storage routines at the two schools with the highest Grade 7 rates.
That sentence is more useful than ‘breakage is high.’ It identifies what is known, what is not yet known, and the next comparison to make. It also prevents the district from applying a systemwide fix to a concentrated problem.
Keep November focused on the pattern.
This review is intentionally operational. It can support a decision about reporting categories, device care, storage, cases, repair routing, warranty handling, or workflow ownership. It should not yet become a total-cost exercise. First identify the concentration and confirm that it repeats. The financial impact belongs in the next step of the season.
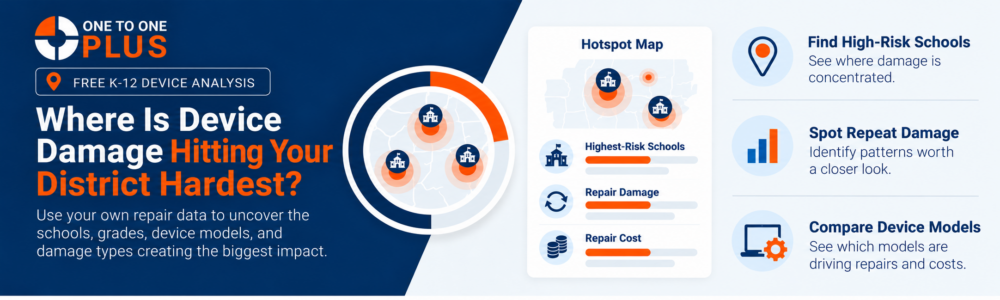
The Breakage Pattern Hotspot can help a district test one suspected segment against its own baseline. It should calculate the segment’s share of the fleet, share of incidents, relative incident rate, and repair-turn-time difference, then suggest the next view to check. It should not assign a universal grade or tell a district that its rate is ‘good’ or ‘bad.’
ancing the Learning Experience with Chromebook Accessories Enhancing the Learning Experience with Chromebook Accessories
See What's Behind Your Breakage Rate
Download the free K-12 Breakage Analysis Guide to go beyond one districtwide number.
Frequently Asked Questions
How can school districts identify device breakage patterns?
School districts can identify device breakage patterns by reviewing repair records by damage type, school, grade and usage model, device model and age, timing, repeat history, and repair outcome. Compare each group with the district baseline using the same reporting period and definitions. Investigate concentrations that appear repeatedly before choosing a response.
How do you calculate a school Chromebook damage rate?
To calculate a Chromebook damage rate, divide the number of unique Chromebooks with physical damage by the number of active Chromebooks in the same reporting period, then multiply by 100. Count each damaged device once. Track total damage incidents separately so repeated repairs do not inflate the percentage of devices affected.
What is a good device breakage rate for a school district?
A single breakage percentage cannot tell a district whether its rate is acceptable. Comparisons depend on device age, usage, reporting practices, and what counts as damage. Start with your district’s own baseline and compare similar groups over consistent reporting periods. Keep physical damage, hardware failure, and loss or theft separate.
Which device damage categories should schools track?
Schools should track distinct physical-damage categories such as cracked screens, liquid damage, damaged hinges, broken cases, damaged ports, and damaged keyboards. Record hardware failures, missing accessories, and lost or stolen devices separately. Clear category definitions help technicians classify incidents consistently and make repair reports easier to interpret.
How can schools compare Chromebook damage across buildings or grade levels?
Compare damage incidents per 100 active devices in each building or grade level during the same period. Then check device model, age, and whether students take devices home or use them only at school. Raw repair counts alone can hide a higher incident rate in a smaller group.
Why does the same school device keep needing repairs?
Repeated repairs may reflect an unresolved problem, a vulnerable component, an ineffective case, or handling and storage practices. Review the device’s repair history, previous assignees, damage categories, and repair outcomes. Repeated damage to one device does not automatically mean the same student caused every incident.
How should schools measure device repair turnaround time?
Measure repair turnaround from the initial report until the device is usable and ready to return to service. Use the median to describe the typical completed repair, and review the age of open repairs separately. Compare results by repair outcome to identify delays involving parts, approvals, vendors, or staff handoffs.
How can school districts reduce student device breakage?
Use repair data to identify a recurring damage pattern, then choose a targeted response. Depending on the findings, that may mean reviewing protective cases, storage routines, transport practices, device-care reminders, or repair quality. Track the same group and damage category afterward to see whether the incident rate changes.