
Dashboard Reporting
Stay in the Know
Purpose
Improve Decision Making
Overview
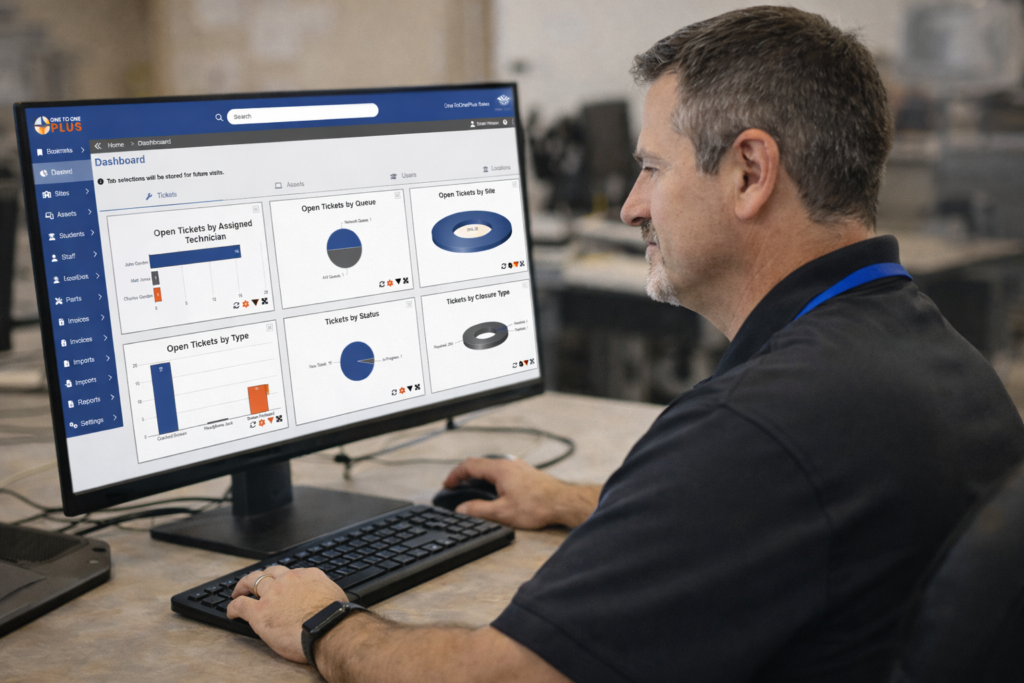
Make Your Data Work for You
Key Dashboard and Reporting Capabilities
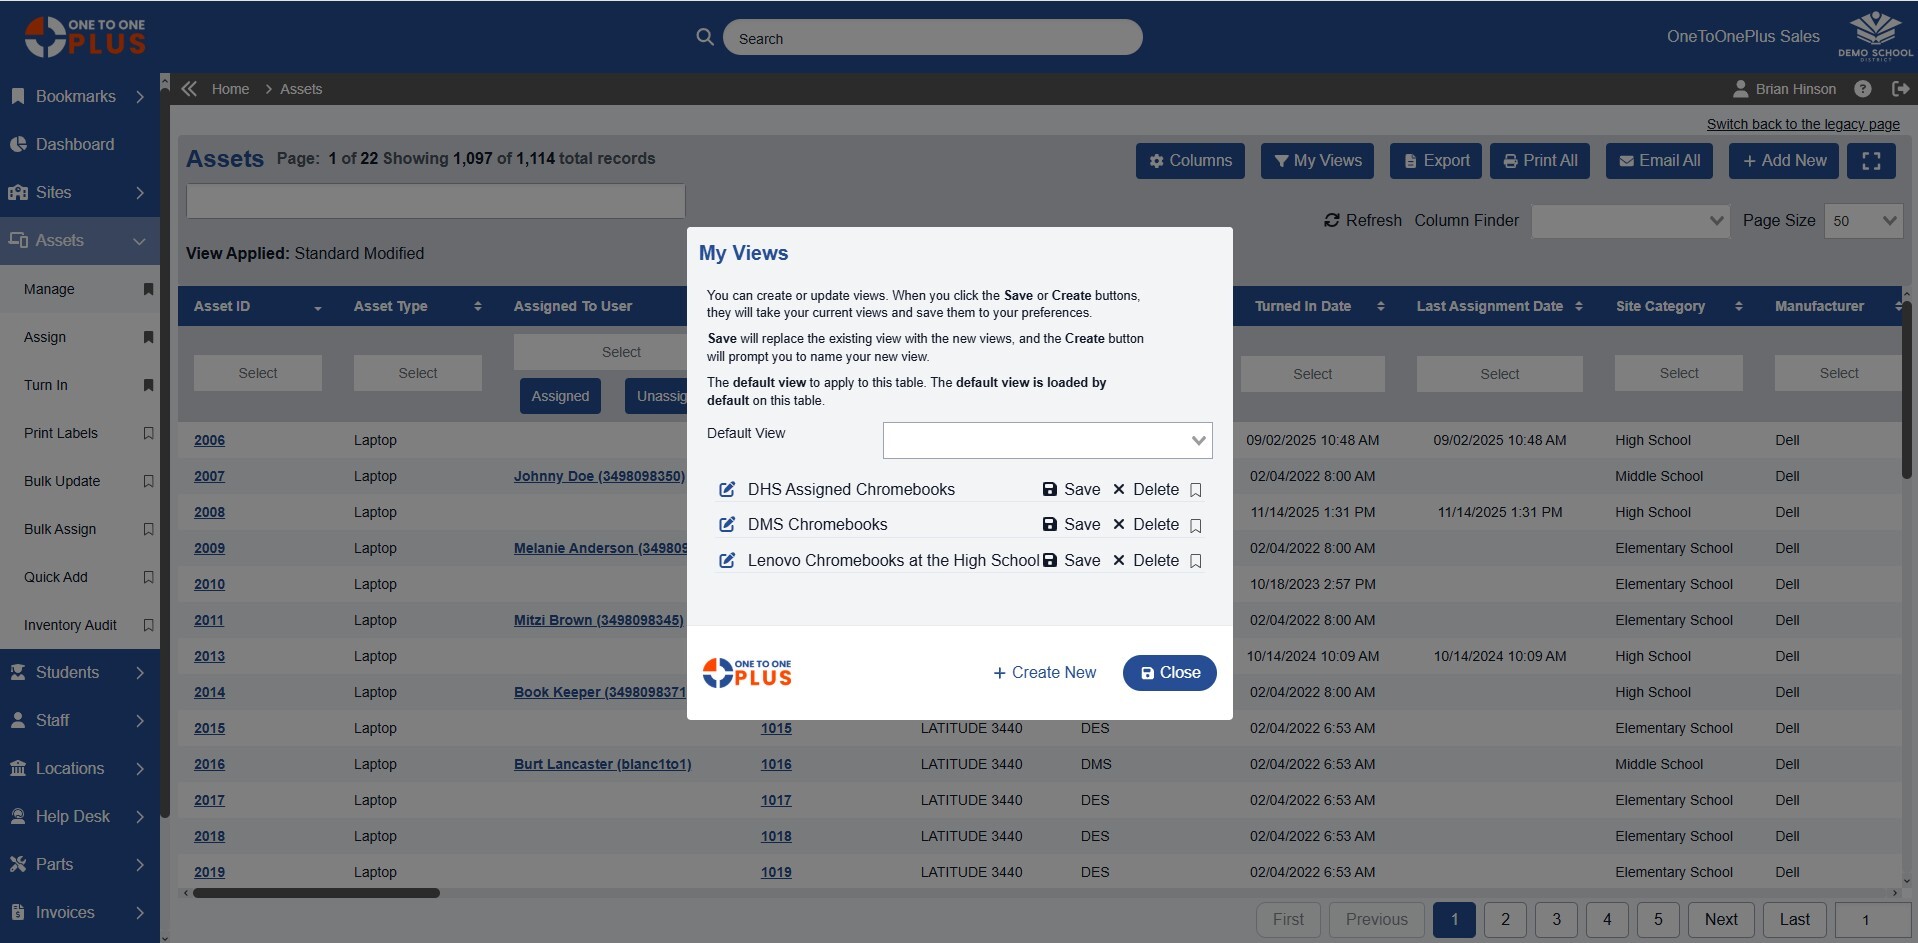
Create and Save Custom Views
- Apply filters to columns to get the data you need
- Arrange columns in the order that works for you
- Save frequently used views for quick access
- Review critical data without running reports
- Export view data for data sharing and analysis
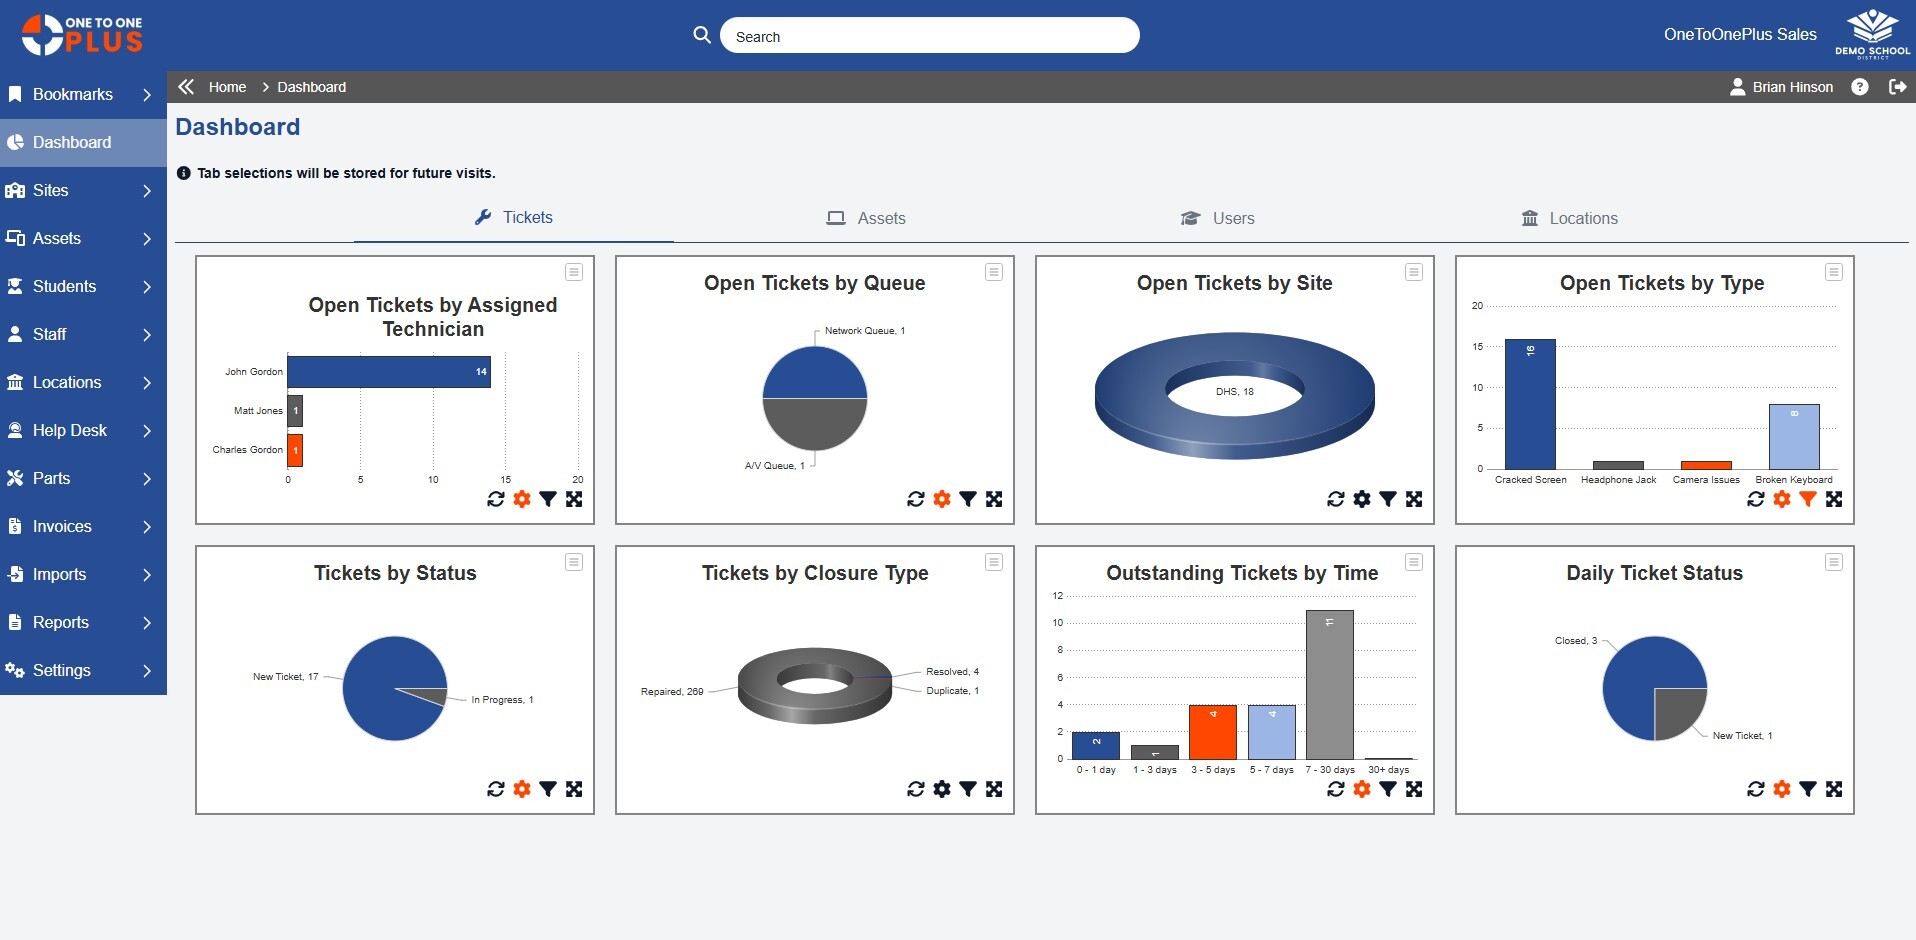
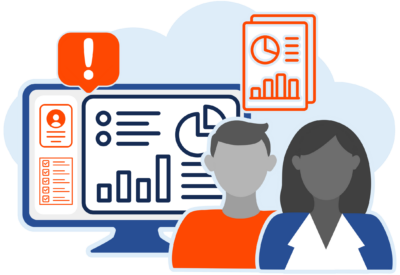
Monitor Key Metrics at a Glance
- Track key metrics across assets, tickets, users, and locations
- Visualize trends with charts and graphs
- Monitor activity in real time to spot issues early
- Compare performance across schools, departments or technicians
- Review high-level insights without running manual reports
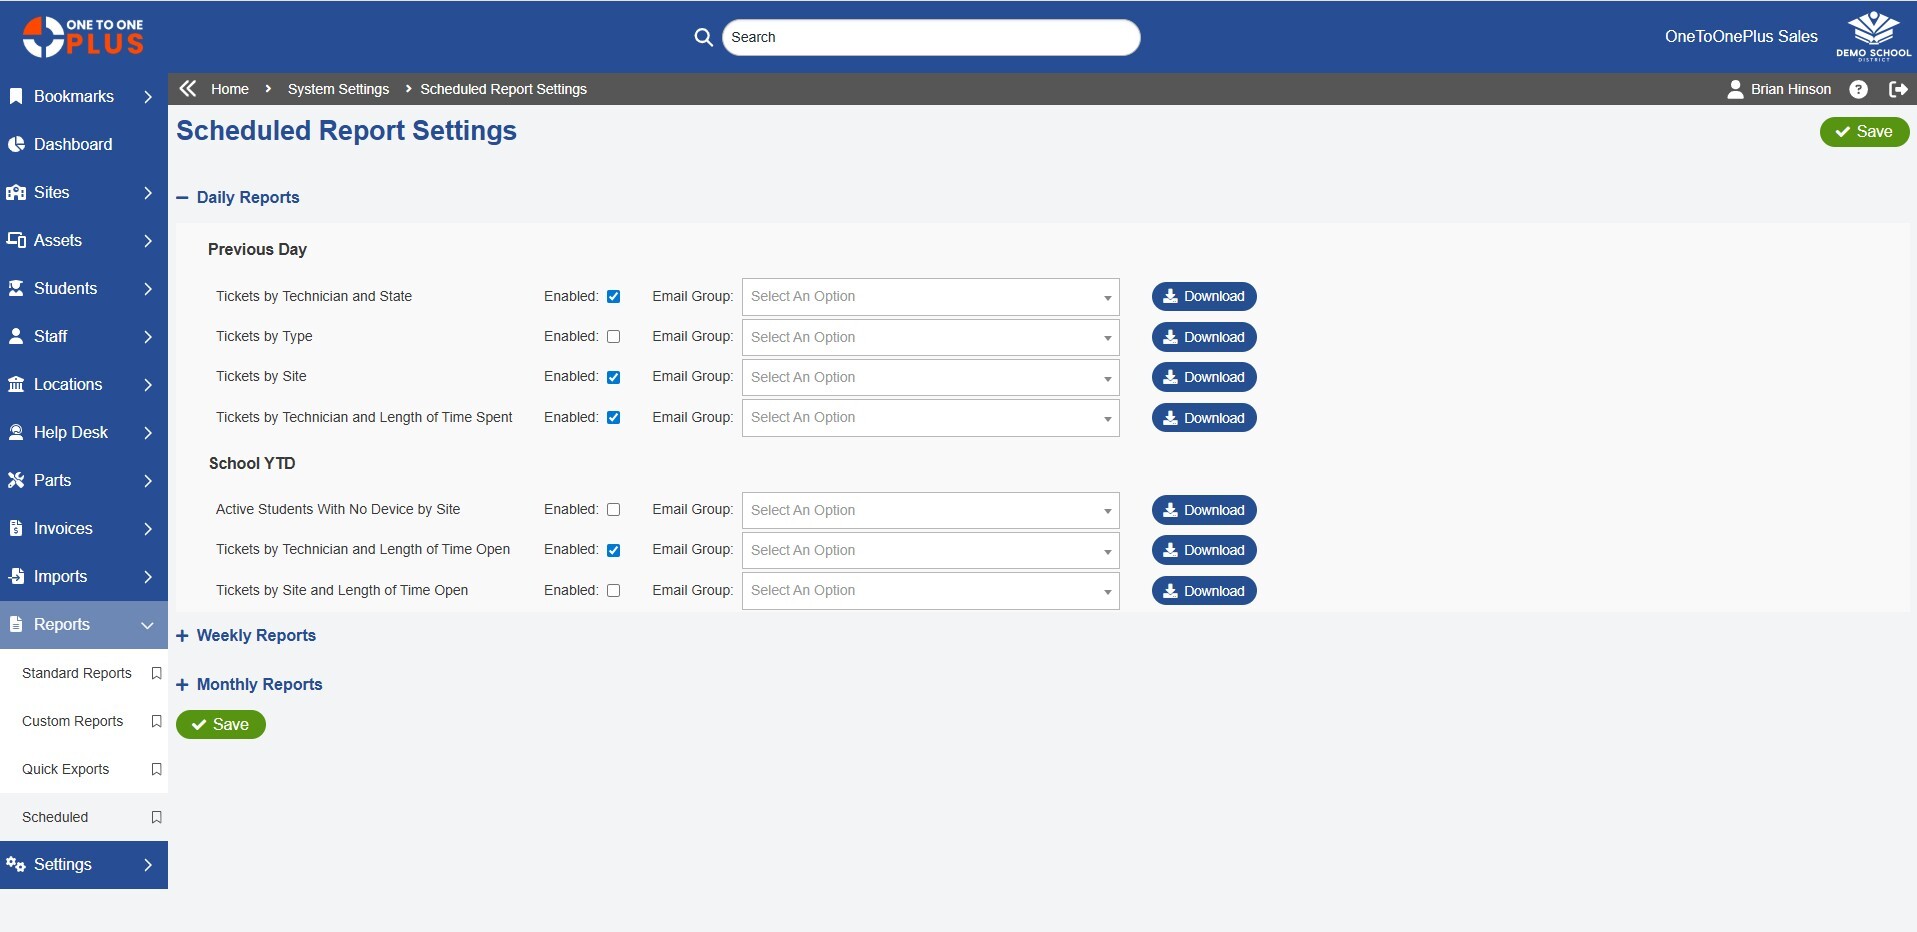
Automate Recurring Report Delivery
- Automate report delivery on daily, weekly or monthly schedules
- Send reports directly to stakeholders via email
- Select recipients for specific reports
- Reduce manual reporting tasks for your team
- Ensure leadership always has up-to-date information
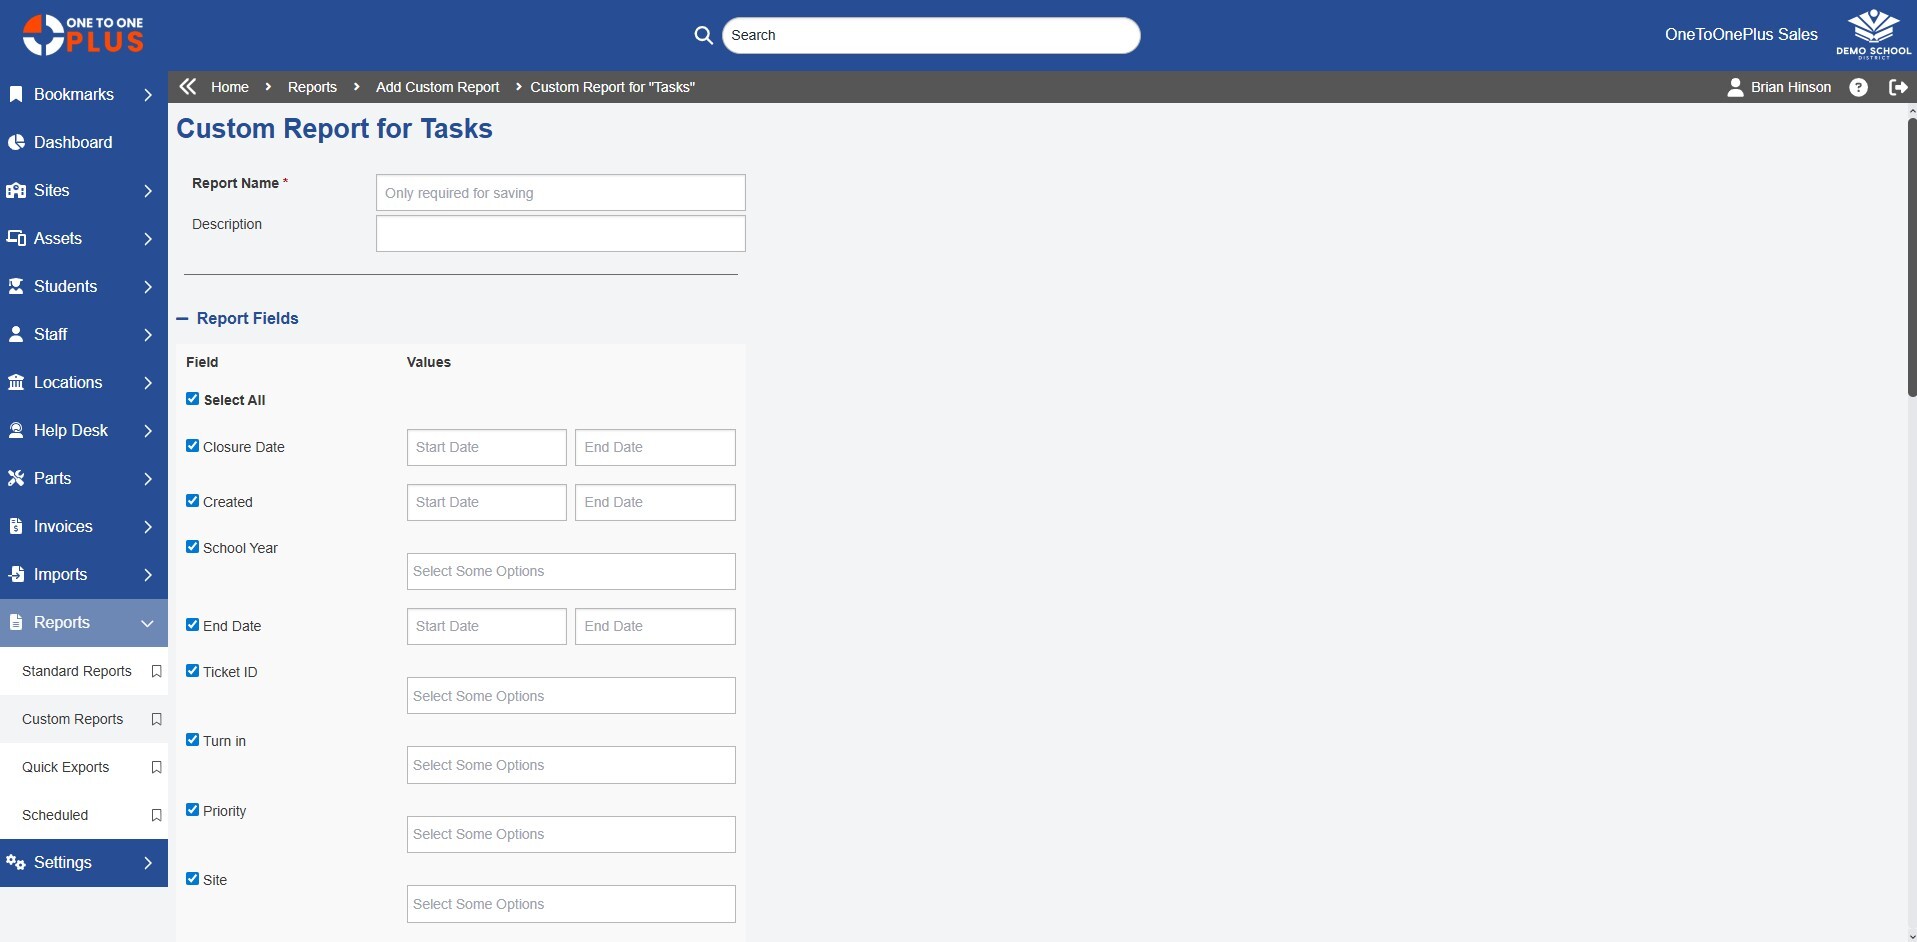
Build Reports Tailored for Your Needs
- Build reports using predefined or custom data sets
- Group and sort data to highlight key insights
- Apply filters to focus on specific schools, devices, or timeframes
- Save specific reports for quick access
- Export report data to CSV or Excel for sharing or analysis
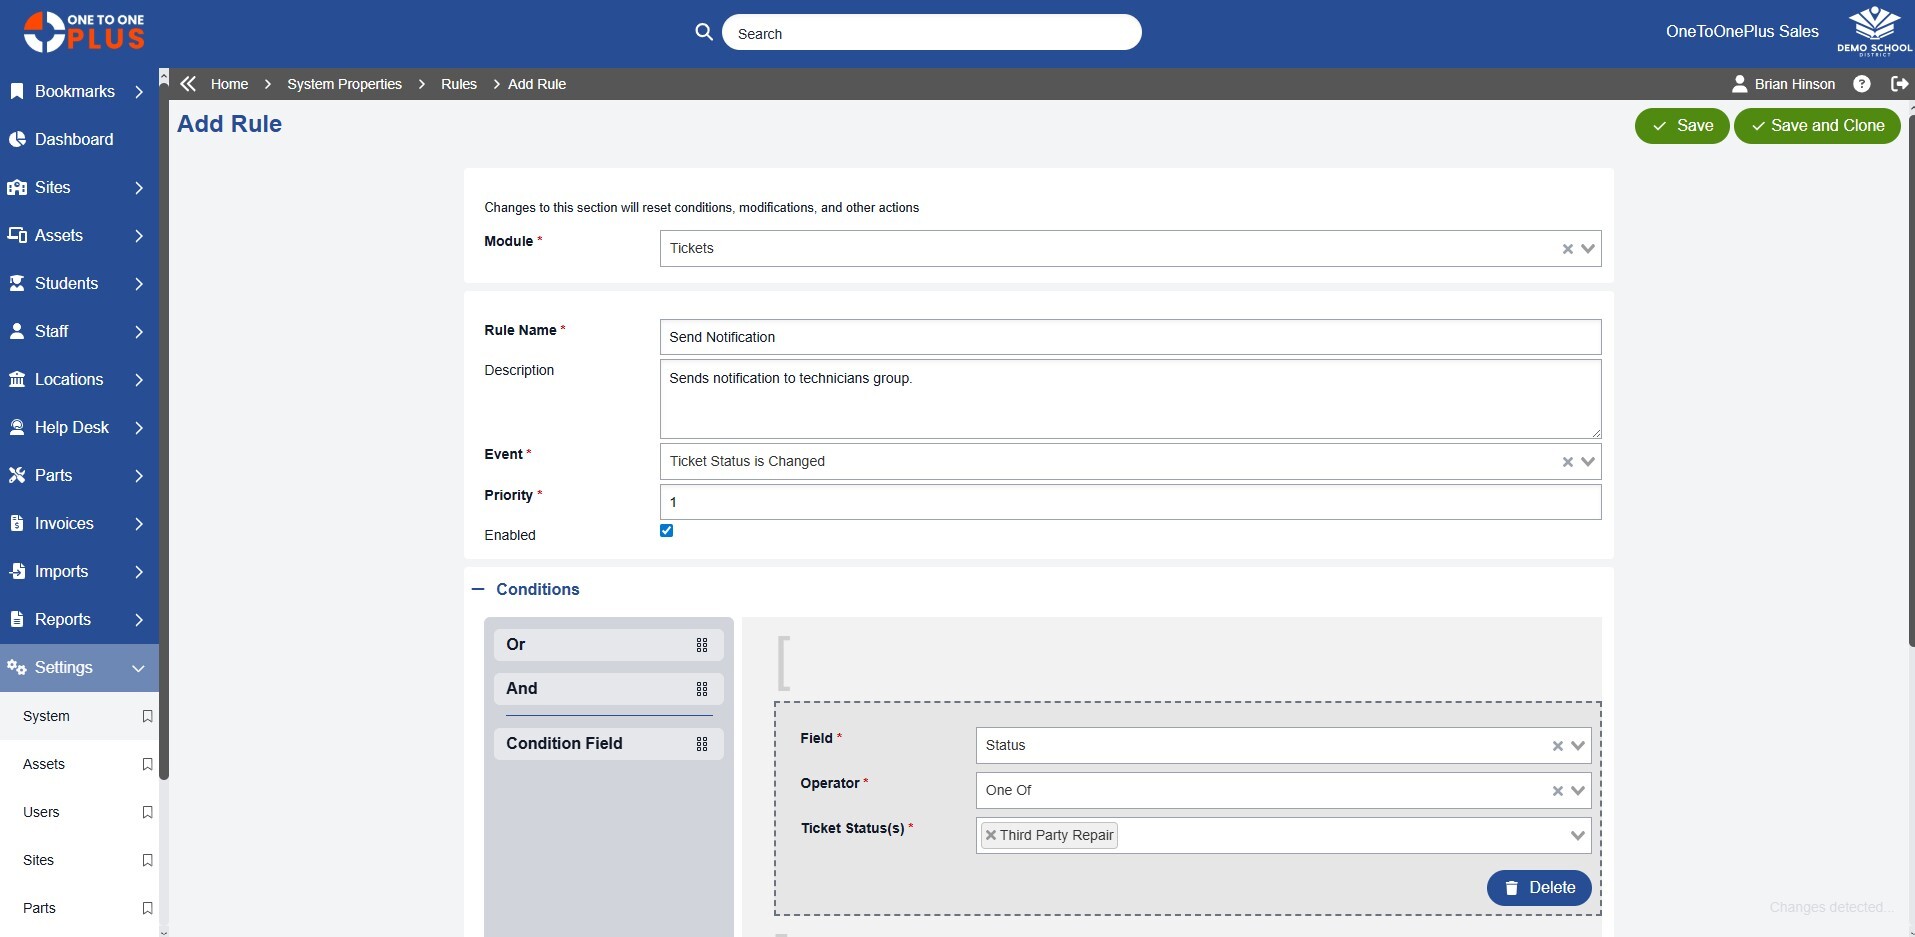
Control Alerts and Updates
- Configure alerts based on activity, status changes, or thresholds
- Control which events trigger notifications
- Assign notifications to specific roles or users
- Reduce noise by limiting unnecessary alerts
- Stay informed without constantly checking the system
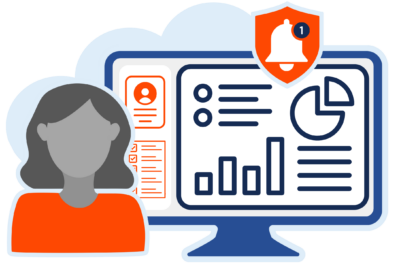
Manage
Get the Data You Need
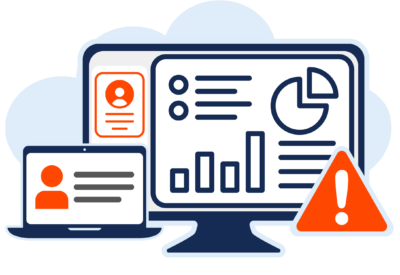
View
See What Matters
Customize
Configured Your Way
Solution
Everything Works Together


Reviews
Our Customers Say It Best
“The wide variety of features including invoicing, parts inventory, help desk and asset management allowed us to consolidate our data into one easy to use space.”
Ed Kobus
Assistant Dir of Technology
Parkland School District
“I find the dashboard layout very intuitive and straightforward.”
Fredrick Hunter
CTO
Fort Wayne Comm. Schools
“One to One Plus streamlined the process of tracking and checking in and out computers to students and teachers.”

Daniel Newman
Database Analyst
Hamblen County BOE
“The customized format is straightforward and easy to use.”

Kathy Fetch
Tech Admin Assistant
Sweetwater County SD 2
“They are always adding features as well so it feels fresh and modern.”

Kyle Arnett
Director of Technology
Taylor County School District
Your Simpler System Starts Here

Custom Demo

Quick Tour

Request Pricing
Frequently Asked Questions
What reporting features does One to One Plus provide?
One to One Plus provides dashboards, custom views, reports, exports, charts, graphs, and notifications to help districts monitor assets, tickets, users, locations, and technology trends.
Can One to One Plus dashboards show real-time data?
Yes. One to One Plus dashboards give districts real-time visibility into key asset, ticket, user, and location data so teams can spot issues and make faster decisions.
Can reports be customized?
Yes. Districts can build reports using filters, groups, sorting, custom data sets, schools, devices, users, locations, timeframes, and other criteria.
Can users save custom views?
Yes. Users can create and save custom views by filtering data, arranging columns, and keeping frequently used information easy to access.
Can reports be scheduled automatically?
Yes. One to One Plus can automate recurring report delivery on daily, weekly, or monthly schedules and send reports to selected stakeholders by email.
Can reports be exported?
Yes. Report data and view data can be exported for audits, presentations, analysis, or sharing with district leaders.
How does reporting help school districts?
Reporting helps school districts make better decisions by giving technology teams clear visibility into inventory, ticket activity, device trends, staff workload, and operational performance.
Can One to One Plus send alerts or notifications?
Yes. Districts can configure alerts and notifications based on activity, status changes, thresholds, roles, or users so the right people stay informed without unnecessary noise.